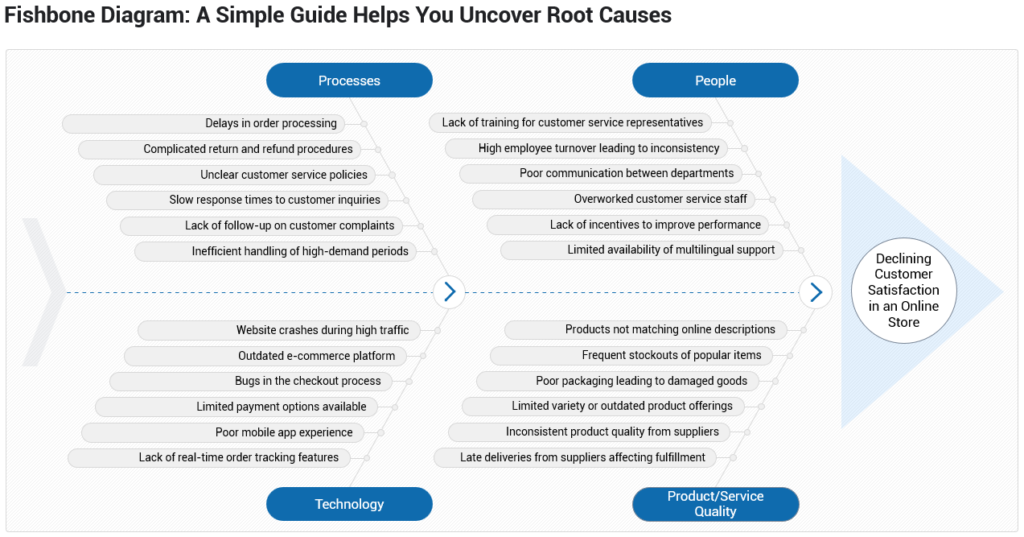
Ever feel like solving a problem is like chasing your tail—going in circles without finding the real issue? That’s where the Fishbone Diagram steps in.
Also known as the Ishikawa Diagram, this handy tool helps you cut through the noise, organize your thoughts, and pinpoint the root causes of your challenges.
What is the Fishbone Diagram?
The Fishbone Diagram is a visual method for organizing and analyzing the possible causes of a specific problem.
Just imagine what a fish skeleton looks like: the “head” is the problem, and the “bones” are the categories of potential causes. It’s like a map to help you uncover what’s really going on.
At its heart, the Fishbone Diagram is all about categorizing and connecting causes to effects. The beauty lies in its simplicity—you group possible causes into logical categories and work through each one systematically.
Why Does It Help?
The magic of the Fishbone Diagram is in how it transforms messy, scattered ideas into a clear, actionable picture.
These are the key factors why it’s so effective:
- Focus on Root Causes: It’s not about fixing symptoms; it’s about addressing the deeper issues.
- Encourages Collaboration: Great for team problem-solving, as it captures diverse perspectives.
- Saves Time: By organizing your thoughts, you can quickly narrow down what matters most.
When To Use It?
Think of the Fishbone Diagram as your go-to tool when:
- You need to diagnose quality control issues in a process or product.
- A problem feels complex and overwhelming, with too many potential causes.
- You’re working on process improvement and want to identify inefficiencies.
- It’s time for a root cause analysis, whether for a business challenge or an operational bottleneck.
Unlock all frameworks and templates
Unlock exclusive thinking frameworks and practice templates.
Become a member to access all premium content to elevate your thinking!
Relationship Between the Fishbone Diagram and the 5 Whys
The Fishbone Diagram and the 5 Whys are closely related and often work together as part of a thorough problem-solving process, they actually complement each other quite well.
Overall, the Fishbone Diagram gives you a broad overview of possible causes, and 5 Whys helps you drill down to the root cause of a specific issue identified in the Fishbone Diagram.
How They Work Together?
Start with the Fishbone Diagram
Begin by mapping out all the potential causes of the problem using the Fishbone Diagram. This helps you identify different factors that could be contributing to the issue.
Use the 5 Whys to Dive Deeper
Once you’ve identified a category or potential cause from the Fishbone Diagram that seems significant, use the 5 Whys technique to explore that cause further. Ask “Why is this happening?” for each answer you get, until you reach the root cause.
Sample: Fishbone in the Manufacturer Field
Context: Break down the issue into 6 areas, each containing a couple of reasons.
Equipment
- Malfunctioning or outdated machinery
- Lack of proper maintenance
- Incorrect usage of equipment
- Unavailability of necessary tools
Process
- Inefficient workflow
- Lack of standardized procedures
- Communication gaps in process execution
- Bottlenecks causing delays
People
- Lack of training or expertise
- Miscommunication between team members
- Insufficient staffing
- Human error due to fatigue or oversight
Materials
- Poor raw material quality
- Material unavailability
- Incorrect specifications
- Supply chain disruptions
Environment
- Unsafe conditions
- External disturbances
- Poor organization
- Lack of ergonomics
Measurement
- Inaccurate data collection
- Faulty measuring tools
- Lack of real-time monitoring
- Misinterpretation of results
Template
Get into the real practice now.

Available in the Templates
Go to Templates to download the resource.

